


When it comes to minting XEN, the user is faced with a plethora of 12 different blockchains to choose from, with gas fees, mint term length, the number of addresses, or the kind of XENFT. Despite a very simple smart contract like XEN, there’s a certain amount of data to be taken into account when looking to get the most out of the available amount of network fees that need to be paid. Fortunately, the Xenturbo.io website, with its amazing dashboard, is here to help you make the right choice.
What is Xenturbo.io
CryptoCell Labs developed the product known as Xenturbo. It’s the first website that brought us the XEN claim and mint monitor, so everyone can add their addresses and monitor their incoming mints.
In their portfolio section, it’s possible to see all your XEN holdings in one place. XEN mints have a 7-day progressive penalty, and when the mint reaches maturity, this penalty is applied. After one week, there’s just 1% of the whole mint left up for grabs, so it’s important to monitor your mints, and Xenturbo helps with that.
Other than this, the users can estimate the cost of their mints and create a strategy with real data at hand.
The team also came up with a dashboard visualizing the stats regarding the XEN supply, minters, burns, and much more.
The website also has a section dedicated to XENFTs and their custom-built miners. The miner is used to mint XEN in bulk with reusable slots, which lowers the price of the mint. Their XEN mint calculator will help you input the budget and estimate the cost.
Overall, Xenturbo is a complete website that every XEN minter should know about.
The Xenturbo dashboard
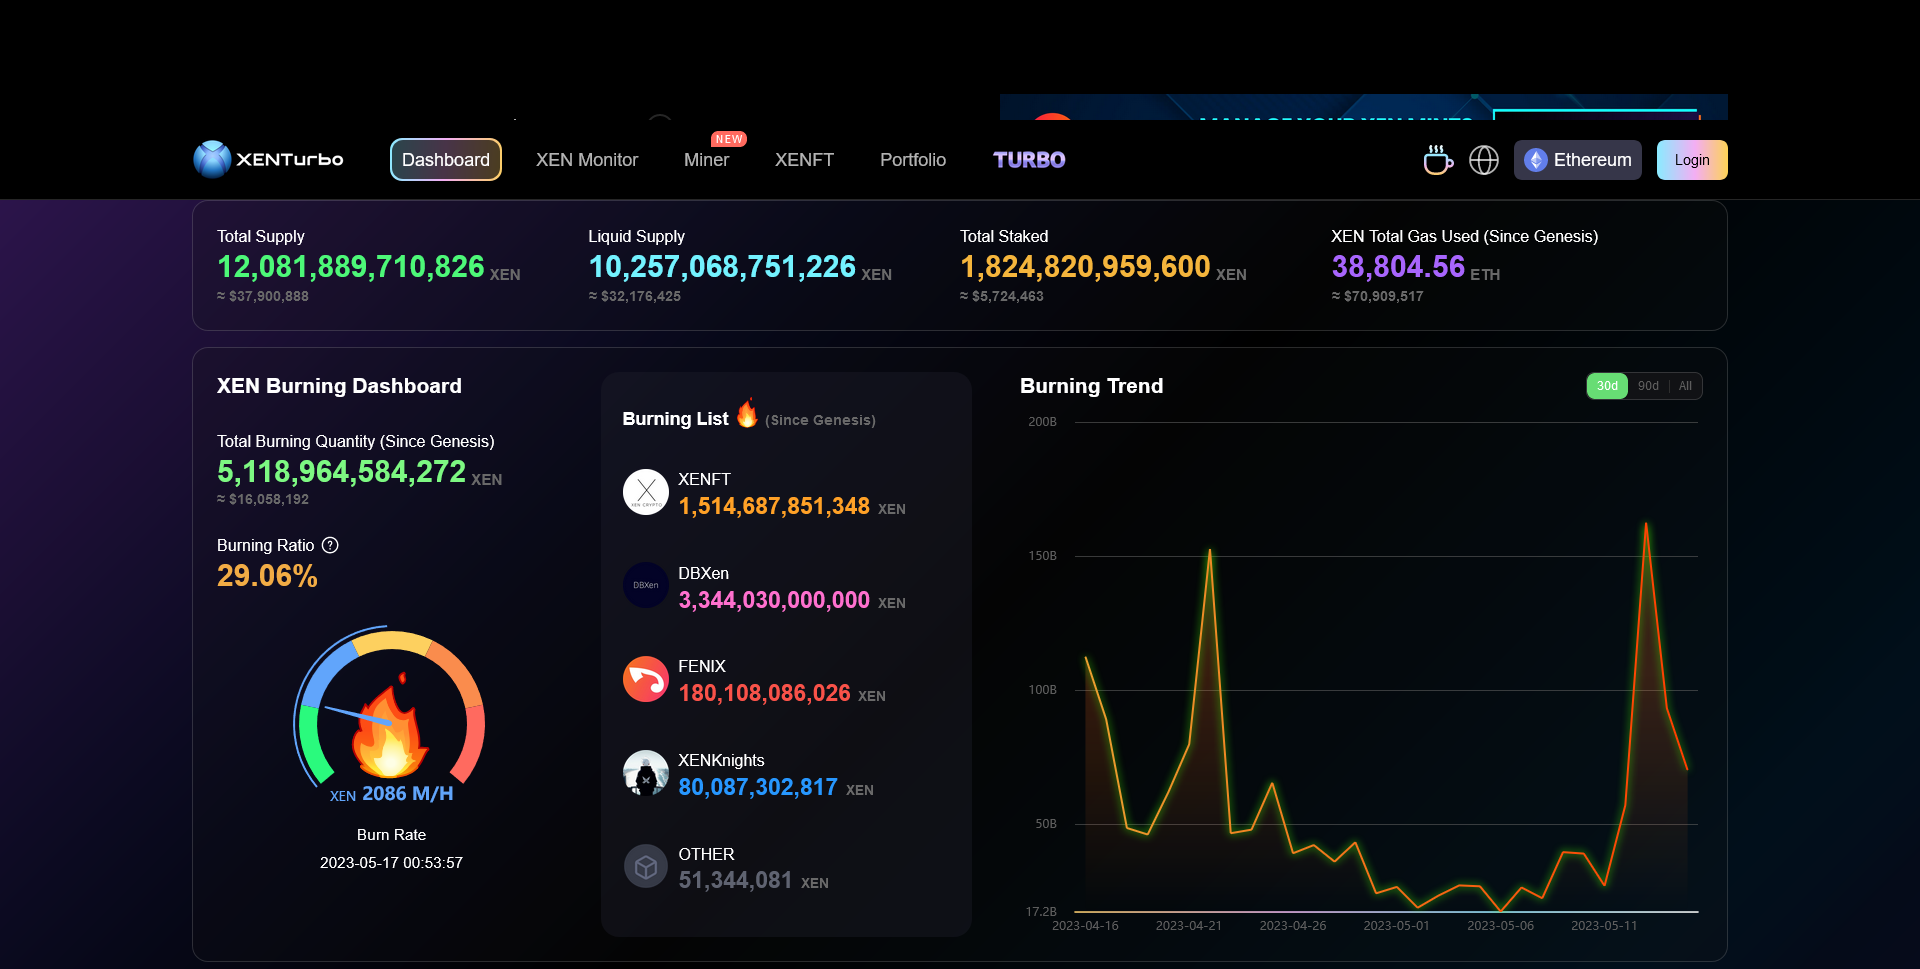
The dashboard presenting the burn rate, XEN mining, and XEN supply distribution is the most screenshotted page by the XEN community. This is because the data provided and wrapped in fantastic graphics is so important for XEN. Let’s have a look at what these data are and how to use them for better decision-making when it comes to minting XEN.
XEN Supply

Total Supply – is the sum of Liquid Supply and Total Staked
Liquid Supply – is the difference between Total Claims, Staking Amount and Total Burns
Total Staked – is the sum of all staked XEN
XEN Total Gas Used (since Genesis) – is the total gas used for XEN mints from standard, single mints, and different batch minters
XEN Burning Dashboard
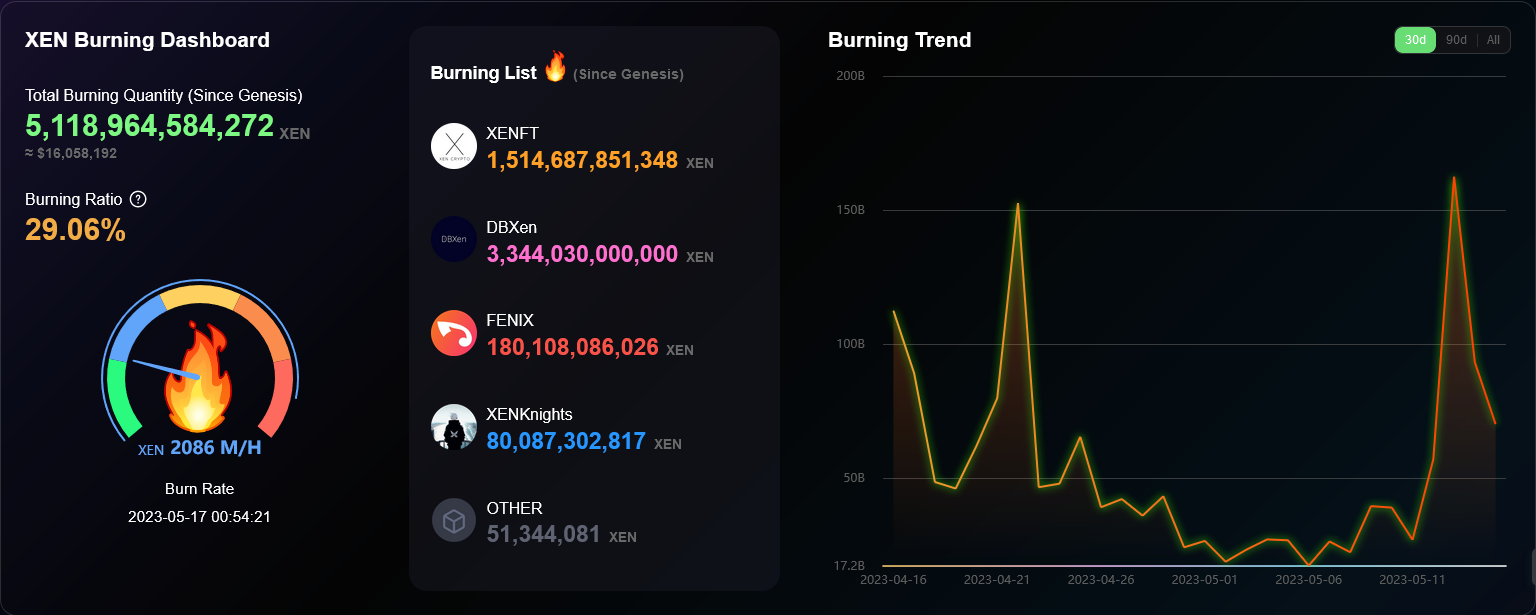
This part of the dashboard is important to the XEN supply. If the burning rate is high, that means that XEN supply is disinflationary or even deflationary. Decreased supply usually means that demand should follow. If the demand for XEN is high, then there are two options: more mints or more buys from the market and an increasing price. We see that the burn started with the launch of XENFTs in December 2022. The daily burn then accounted for 113 billion XEN, but it’s only with the advent of the DBXen protocol that the burn has been constant, and now, with the Fenix protocol launched lately, it should be ongoing at a higher rate. With more burning protocols coming, like Xendoge or DBXENFTs, the burning rate should go even higher.
The Burning Ratio, on the other hand, is the total of all burns divided by Liquidity + Stakes + Burns + Penalties. At the time of writing, it’s at 29.05% and predicted to grow.
It depends a lot on the mints that are coming to maturity, and the rate of this burn can be forecasted by looking at Future Claimables. It’s also possible that when gas fees are high and people don’t get to claim their mints, the penalties may also influence this burn ratio. With XENON gasless transactions, this may be a lesser issue, though.
XEN Crypto Network Mining

This part of the dashboard focuses on minting, where each user’s address is a miner. A user can have many miners. The green chart shows Network’s Hash Power which is the total gas consumed by the network’s minting addresses, while Network Machines are the total number of Active Minters. Active minters is the Global Rank of all the minters minus Claimed cRank. This number surpassed 6 million in April. The heart of the dashboard and of XEN as a whole as it signals the XEN minters liveness is the XEN Network Beats section, which is the count of how fast the Global Rank increases in a minute. This is the minting activity, and together with the Mining Difficulty indicating the current price of the gas fee, this is the most important signal. When Mining Difficulty aka gas fee, is high, the minting slows down, as users prefer waiting for a lower gas fee to mint XEN and obtain it at a lower cost.
My Mining

This section is for individual users to visualize their personal mint data. You need to log in with your email address to visualize them.
XEN Total Gas Used

Gas, time, and the number of participants are the most important aspects in determining the number of tokens you’re going to claim. Gas isn’t counted into the minting equation, but it’s obvious that the more gas you have, the more you can mint. This is the reason why the XEN minters take the opportunity to activate their minting machines when the gas fees are very low. We’ve seen, however, that since the XEN burn started, the demand for XEN grew higher, and the minting continued even when gas fees were high. Since XEN’s launch on October 8, Ethereum has turned deflationary as a result of a high fee burn rate. The XEN price also noted an increase because few are willing to sell their tokens below the cost of the mint. The other parts of the dashboard provide more detailed mint cost data.
Cost/cRank
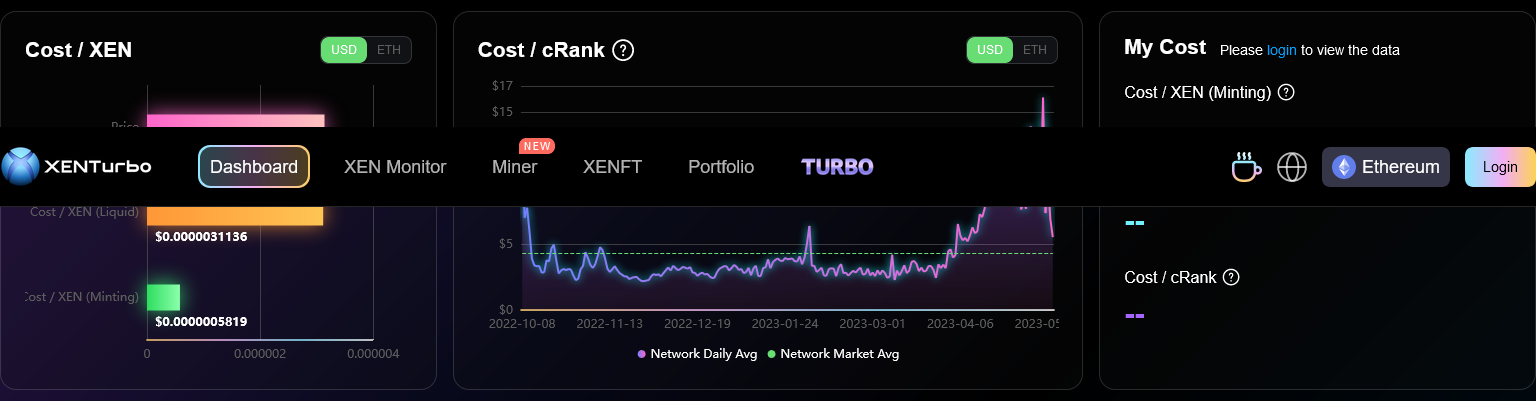
What influences the cost of a single cRank on a global scale is the number of new addresses joining the network and the total gas they spend on their mints. Below are given three formulas for determining the average cost/cRank:
– Network Daily Average cRank Cost = Total Gas Fee of Daily Mints / Daily Number of New Addresses.
– Network Market Average cRank Cost = Sum of Average Daily Cost of cRank / Since Genesis Days.
– My Average cRank Cost = Total Gas Fee of My Mints / My Cumulative Number of Minting Addresses).
We can see that for the most part, the average price was around $3, but when gas fees went up, the cost peaked at $16.
By logging in, you can also see your own costs. There are multiple ways to lower the cost of minting. The most popular is to mint on the weekends, when network congestion is lower and gas is cheaper. The other is to use XENFTs with the maximum number of VMUs to offset the cost of minting an NFT and transferring ETH from wallet to wallet when minting with multiple separate accounts. Xenturbo claims that their XEN minter is able to mint XEN at a lower cost too.
XEN Supply
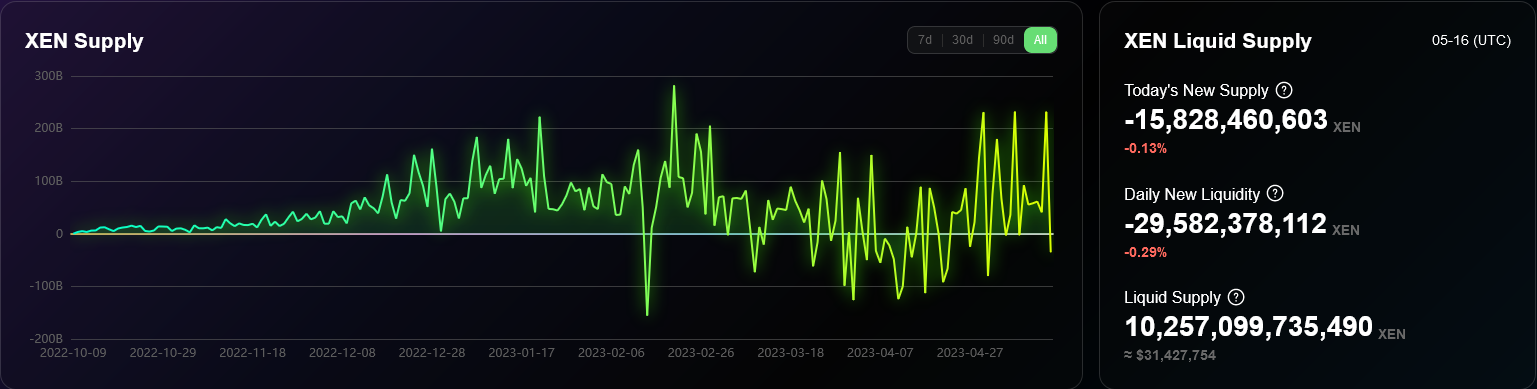

The XEN supply chart shows how much XEN was minted, if it’s in deflation or disinflation mode. This is an indication of demand. When XEN goes into deflation, this may indicate more future demand, and vice versa. XEN will continue to be minted forever. According to the formula, when the AMP reaches 1, XEN will reach a stable 2% inflation rate. This is due to happen in 3000 days since launch.
Over this whole period, the minting difficulty is rising every day, and in the end, the number of new tokens will be very small. Due to burning, XEN may be in permanent deflation mode before this 3000-day period ends. The Future Supply Trends table is a good estimation of the minting progress.
Mint Term Distribution Trends

When XEN launched, it entered its most inflationary distribution phase. Short term minting was very popular, and most of the supply was sold on the market, dumping the price. The inflation was so high, however, that it was still profitable to mint despite the price constantly dropping. As the difficulty has increased, we’ve seen term mints become longer. When gas fees are high, max term mints are the preferred method.
Future Supply Trends
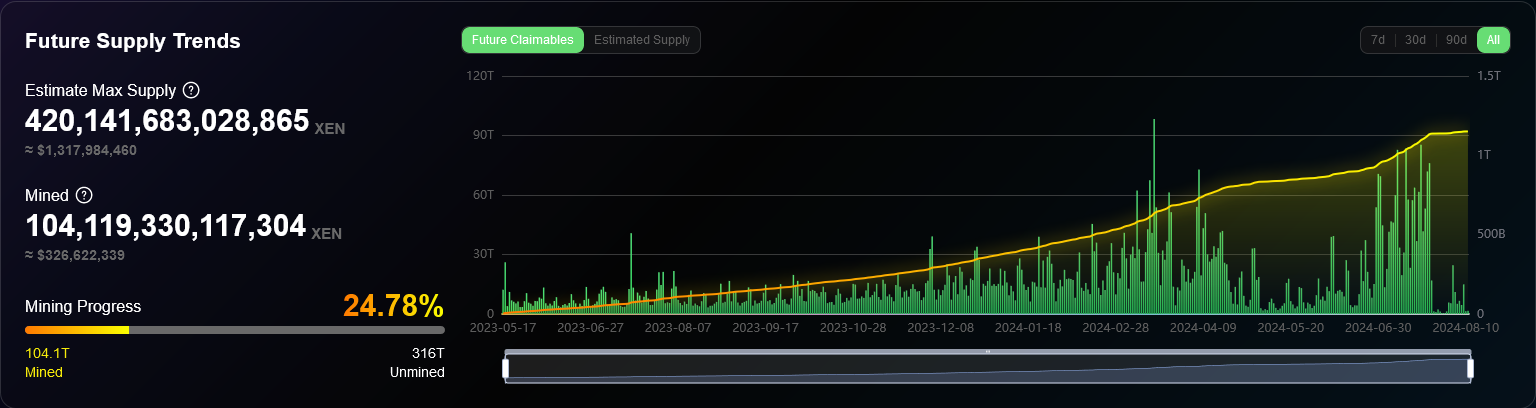
This table shows the minting progress of the XEN supply, and at the time of writing, it indicates that almost 25% of the total estimated supply of 420 trillion XEN has already been mined. XEN has no capped supply, and 420 trillion is the estimation based on parameters such as the current minted term distribution and the newly added Global Ranks in the past 30 days. The Future Claimables chart shows when the XEN mints are reaching maturity. This is an important indication when it comes to strategy. Ideally, you don’t want your mints to reach maturity when everyone else’s mints are coming out too. It could be that they will be sold and the price will go down. In the best-case scenario, they will be burned for something else.
Decision-making
After getting to know all the data, their meaning, and their interconnectedness within different parameters, you will see that it will be much easier to make a decision about your minting strategy.
You may want to mint only long term trying to forecast the cost of future gas and your mint’s profitability. For a max mint term mint to become unprofitable, the gas cost should be very high and the price very low. Most likely, this won’t happen because, as we’ve seen from the correlation of data between the price of gas and the cost of cRank, they go in tandem, so higher gas is likely to bring a higher XEN price.
When it comes to minting short-term, the risk of making an unprofitable mint is higher due to high gas fluctuations and the price not catching up fast enough. It’s probably better to place your mints in periods with a low density of claimable mints. Such a period could provide lower gas fees and, hopefully, a better price.
If you really want to take advantage of short-term minting, then minting when the gas price is the lowest and the burn rate is the highest is your target. What you really want to do is lower your mint term as much as possible and anticipate that high burn to get your mints ready for when it happens. The burn will cause higher demand for XEN Crypto, causing the price to go up. If you’re a long term investor instead, the network hash power rising, the 25% mined supply, and the high burn rate are some really bullish signs, and minting long term is your way to go.


